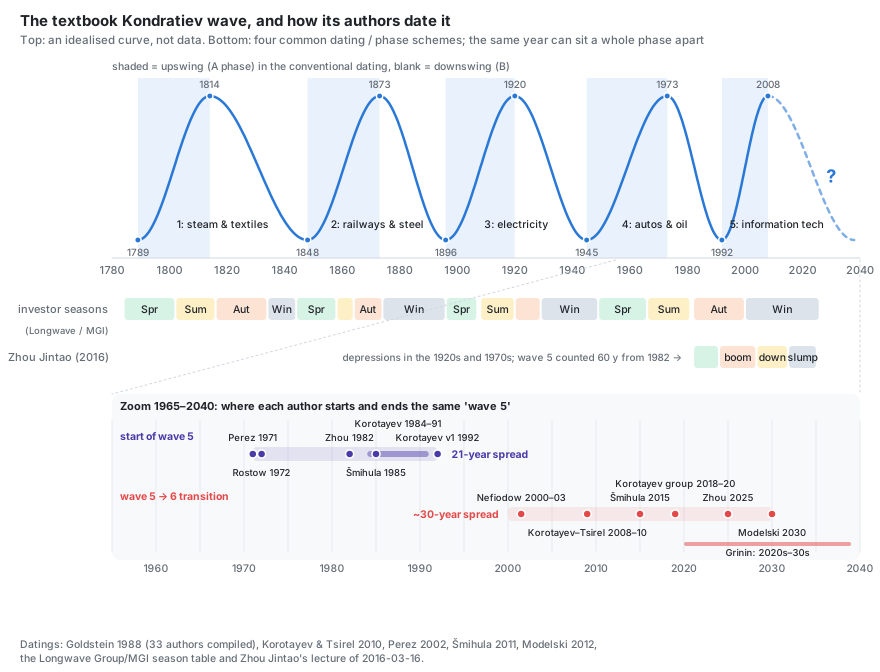
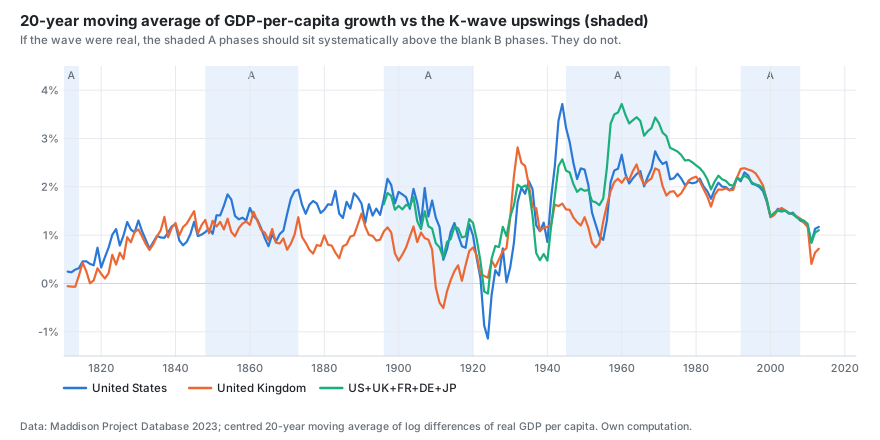
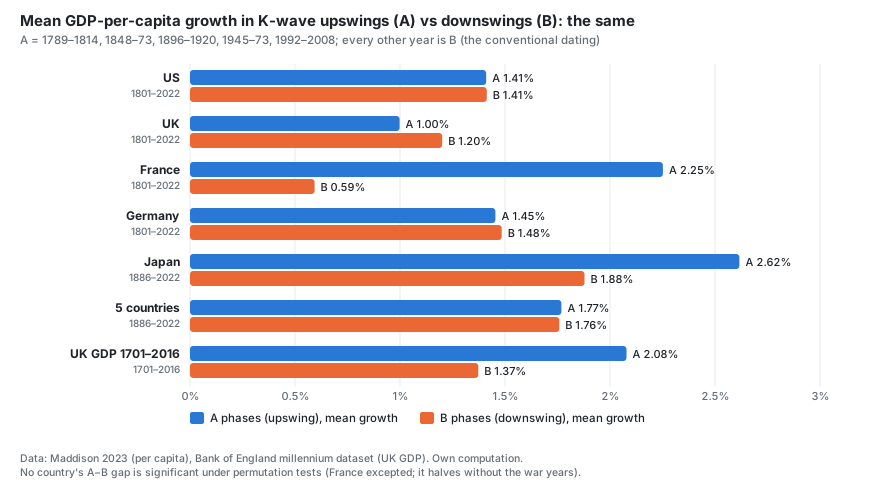
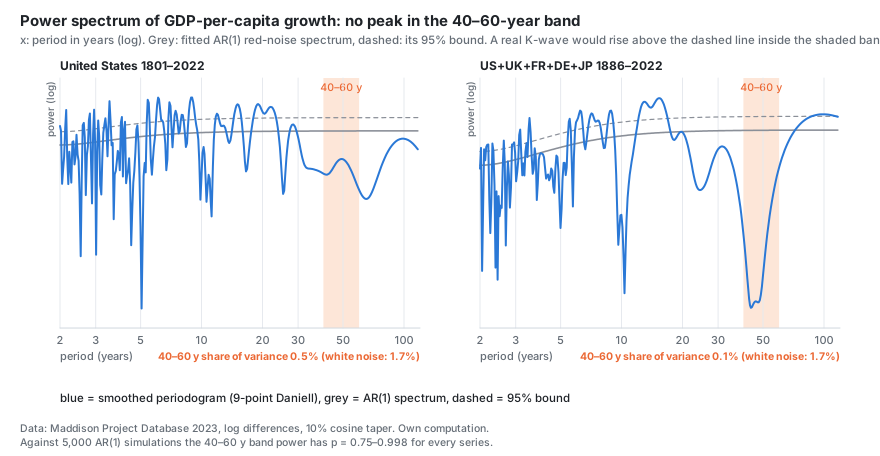
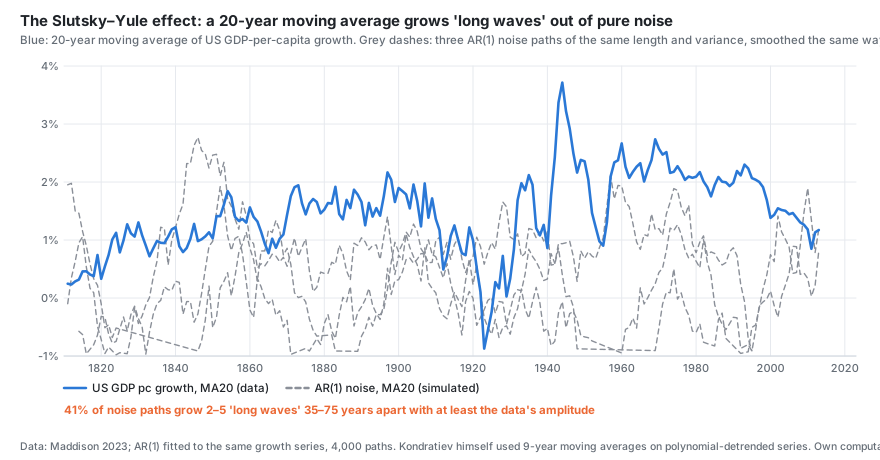
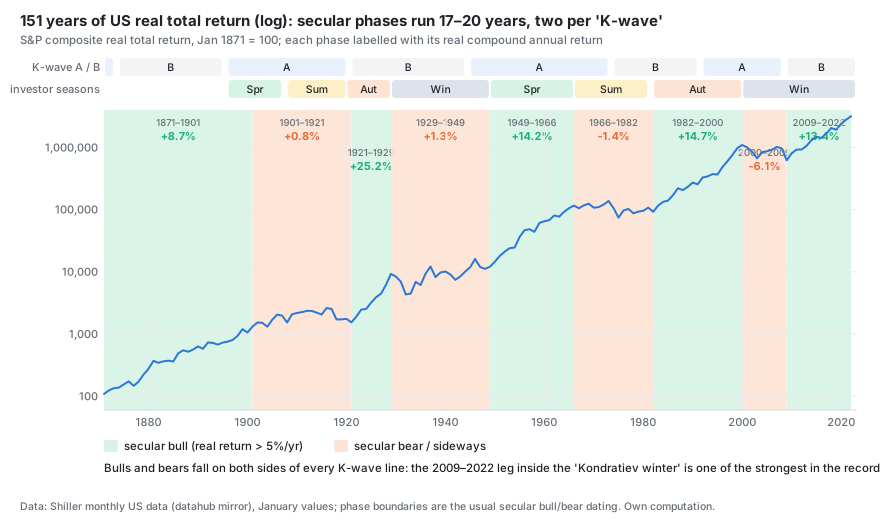
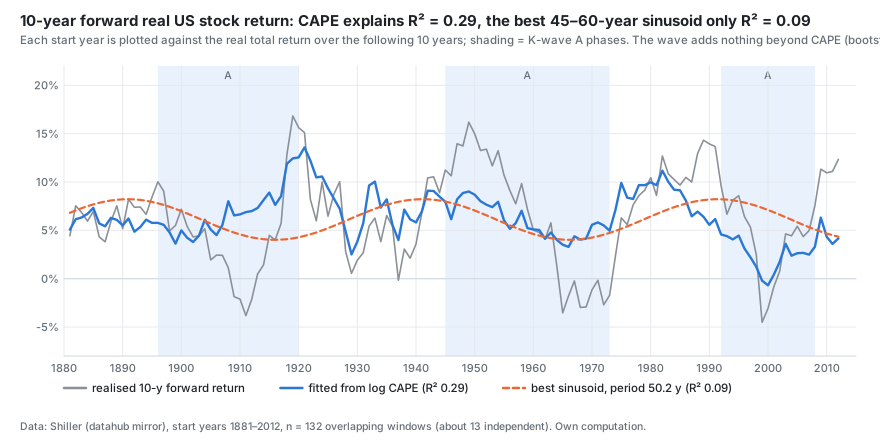
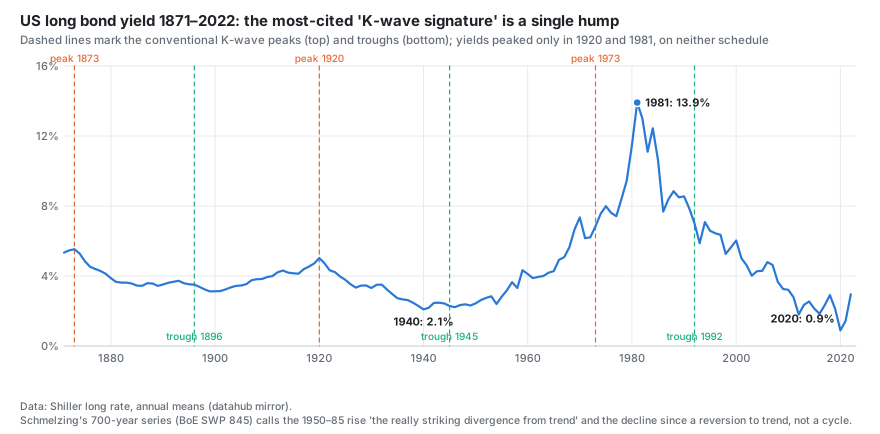
The Kondratiev long wave (康波) is the hypothesis of a 45–60-year economic cycle, famous in China through the slogan "fortunes are made on the K-wave". We reviewed its theory, a century of statistical tests, its actual relationship with stocks, rates and GDP, and the forecasting record of its proponents, and re-ran the tests ourselves on Maddison 2023 GDP for five countries and 150 years of Shiller US stock data. Verdict: the K-wave has no usable predictive power in GDP or stock data; by the usual demarcation criteria it is not strictly pseudoscience either, but an unconfirmed, weakly falsifiable conjecture. The pictures tell most of the story.
1. What the K-wave is: the textbook picture and the datings
2. The K-wave and GDP
3. The K-wave, stocks and interest rates
4. The forecasting record (dated calls, not hindsight)
| Forecaster / date | Call | Outcome |
|---|---|---|
| Zhou Jintao, lecture of 2016-03-16 | Commodity rebound in 2016; A-share decline in 2018 | Hit (inventory-cycle-scale calls) |
| Zhou Jintao, same lecture | Chinese and US assets fall across the board after Q3 2017; 2018–19 the "years of no return", final low in 2019 | Miss: US stocks kept rising after 2017; 2019 was no low |
| Zhou Jintao, same lecture | Wave-5 depression lasts to 2025; dollar bull ends 2017 | Miss: US real equity return about +9.5%/yr since the lecture; global stocks at records in 2025 |
| Ian Gordon (Longwave Group), July 2010 | Dow to 1,000 at a minimum, gold $4,000, Dow/gold 0.25 | Miss: gold reached $4,000 only in 2025, with the Dow above 47,000 and Dow/gold near 12 |
| Harry Dent, books 1999–2025 | Opposite-direction calls through 1999–2015; crashes and deflation in 2016, 2023, 2024, 2025 | All missed |
| Korotayev & Tsirel, 2010 paper | Two incompatible post-2008 readings, one with a K-wave peak in 2018–2020 | Unfalsifiable: one of the two readings is always "right" |
No peer-reviewed paper published a dated K-wave forecast before 2008 or 2020 that was later confirmed, and the 2022 inflation ran against the "winter = deflation" rule. The hits are 1–3-year inventory or valuation calls, or a permanent bear being right eventually.
5. Pseudoscience, or an unconfirmed conjecture?
- Not pseudoscience in the strict sense. By multi-criteria demarcation (Hansson), pseudoscience relies on authority, cherry-picks, ignores refutation and never revises; K-wave researchers publish in refereed journals, report negative results and have revised or dropped their claims (Metz retracted his own 1992 findings; Perez explicitly abandoned fixed periodicity).
- But weakly falsifiable by Popper's standard. Turning points are confirmed only in hindsight, every author re-dates the waves, and a "sixth wave" has been declared to start anywhere from 2000 to 2030. The academic critics (Kuznets, Garvy, Solomou, Maddison, Metz, Diebolt) say "not demonstrated" and "not a useful analytical tool".
- Keep the sequence, drop the calendar. Perez's "big bang → finance-led installation → bubble and crash → institutional recomposition → golden-age deployment" is a mechanism you can reason with; the parts of the K-wave story that do have data behind them have shorter, measurable stand-ins: valuation and inflation regime (CAPE, 17–20 years), credit and house prices (the BIS financial cycle, about 16 years), industrial demand (commodity super-cycles, 30–40 years).
Data and method: Maddison Project Database 2023 (GDP per capita, US/UK/FR/DE/JP, 1800–2022), Bank of England "millennium of macroeconomic data" (UK GDP 1700–2016), Shiller monthly US data (1871–2023, datahub mirror). Spectra are 10%-tapered periodograms with Daniell smoothing, tested with 5,000 Monte-Carlo draws against white and fitted AR(1) noise; forward-return regressions use Newey–West errors for the overlapping windows. Every figure is reproducible with tools/research/kwave/make_figures.py; the full report and the five source notes are in the repository under docs/research/.